Quote Performance and Lead Sources
Two Sales reports for owners and admins. Quote performance shows your win rate by count and by value, the median time to accept and who wins what. Lead sources shows where your leads come from and how many become work. Export either to CSV or PDF.
Quote Performance and Lead Sources
See which quotes you win and which marketing brings in work.
- Quote performance: win rate by count and by value, the median time to accept and the results for each person, system type and lead source
- Lead sources: where your leads come from, how many got a quote, how many you won and what they were worth
- Pick any date range up to 400 days. Both open on Last 12 months
- The owner can download each one as a CSV or a PDF with your logo
- Owners and admins only. Money figures are inc GST
These reports sit under Sales on the Reports page, next to the Money reports and the Job Profitability Report.
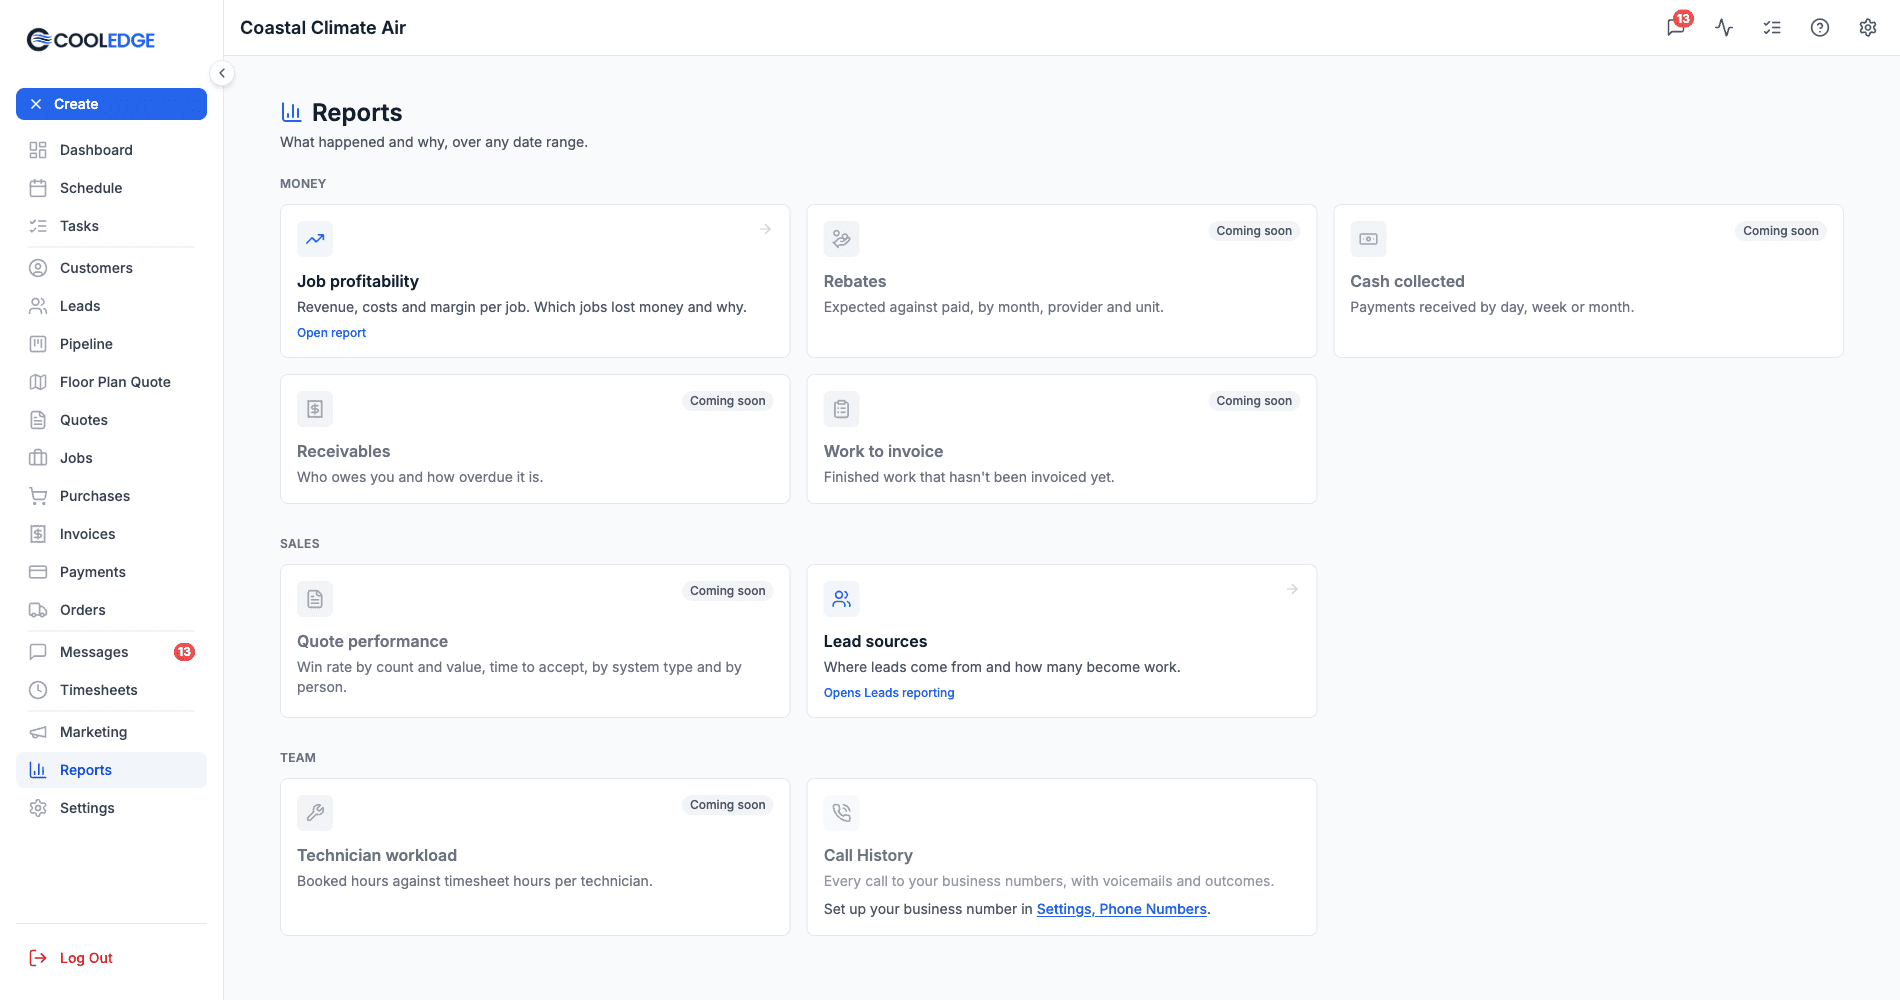
What Each Report Is For
| Report | The question it answers | Counted by |
|---|---|---|
| Quote performance | How many of my quotes do we win? Who wins them? | The day each quote was sent |
| Lead sources | Where do my leads come from? Which ones become work? | The day each lead came in |
Reports are on every plan: Starter, Growth and Scale. Both reports work in ServiceM8 mode.
Using the Reports
Both reports work the same way as your other reports:
- Date range: click the range button for a preset such as Last 12 months, This financial year or Last financial year, or pick a custom range of up to 400 days
- Group by: rolls the rows up. On some groupings you can click a row to see the quotes or leads inside it
- Filters: narrow the rows. A filter changes the headline figures too. Active filters show as chips and Clear all removes them
- Columns: show or hide columns. Your choice is remembered on that browser
- Sorting: click a column heading with arrows to sort by it
- Export: the account owner sees an Export button at the top right, with Download CSV and Download PDF. Exports follow the screen: the same dates, filters, sort and grouping
Quote Performance
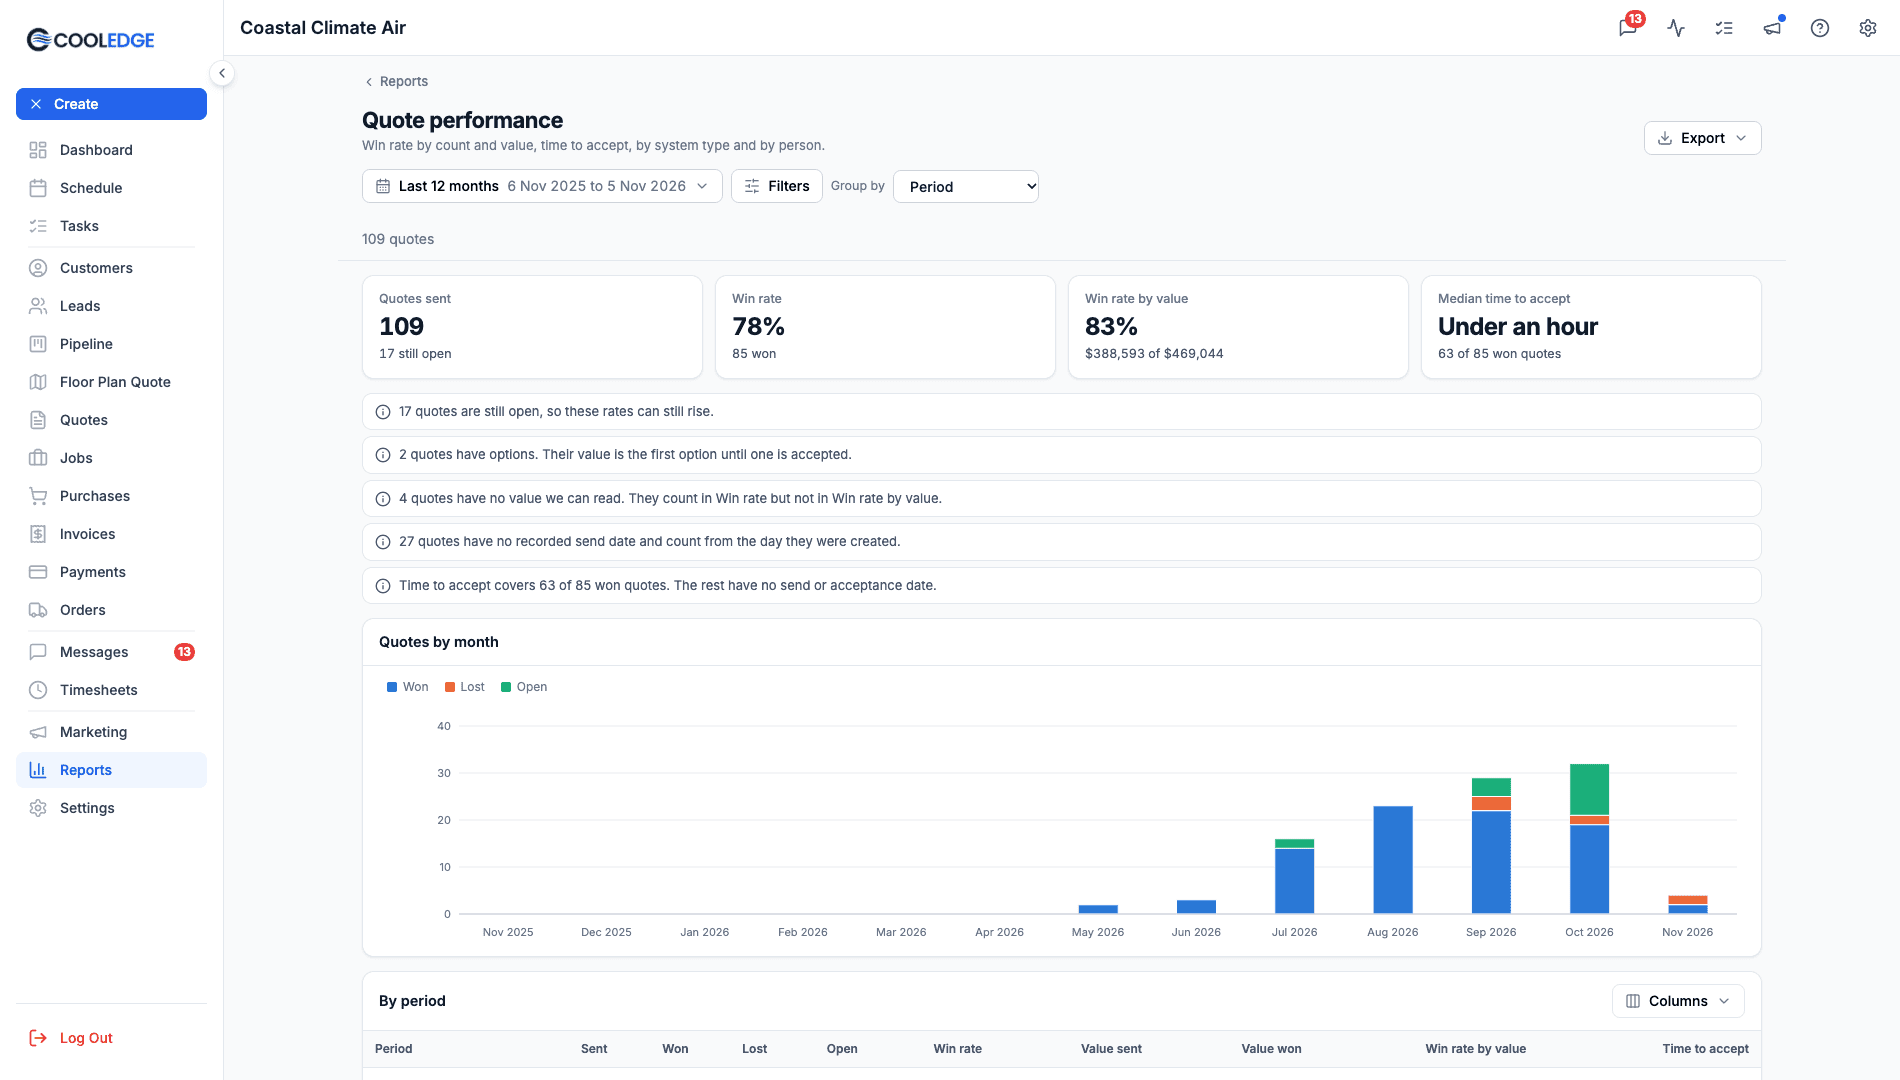
Reports > Quote performance lists every quote you sent in a date range and how it turned out.
Which Quotes Count
A quote is in the range by the day it was sent, in your business's time zone. Each one has an outcome:
| Outcome | Quote status |
|---|---|
| Won | Accepted or Paid |
| Open | Pending |
| Lost | Expired or Archived |
- Drafts never count, even one that was sent once and then went back to Draft
- Archived counts as lost. Archiving is how you mark a quote as dead
- Options sent as separate quotes count separately. If you send a customer two or three quotes to choose from, the ones they don't pick count as Lost once they expire. To keep them out, put the choices on one quote as options instead
- A re-sent quote counts from its latest send. Sending a quote again moves it to the new send date
- A quote with no recorded send date counts from the day it was created. A note tells you how many
Headline Figures
| Figure | What it shows |
|---|---|
| Quotes sent | Every quote sent in the range and how many are still open |
| Win rate | Won quotes out of all quotes sent, with how many were won |
| Win rate by value | The value you won out of the value you sent, such as $388,593 of $469,044 |
| Median time to accept | The typical time from sending a quote to the customer accepting it |
Win rate divides by every quote sent, open ones included. That means it can still rise while quotes are open: a quote you sent last week that's accepted tomorrow lifts this month's rate. A note tells you how many are still open.
Win rate by value uses the accepted amount for a won quote and the quoted amount for the rest. A quote with options counts its first option until one is accepted. A quote with no value Cooledge can read counts in Win rate but not in Win rate by value. A note tells you how many of each.
Median time to accept is the middle value over won quotes that have both a send date and an acceptance date. A few quotes accepted months later don't drag it out the way an average would. The line under it says how many won quotes it covers. Times read Under an hour, then in hours up to two days, then in days.
Group By
- Period (the default): one row per day, week or month, matching the chart. Up to 31 days shows days, up to 92 days shows weeks and longer ranges show months
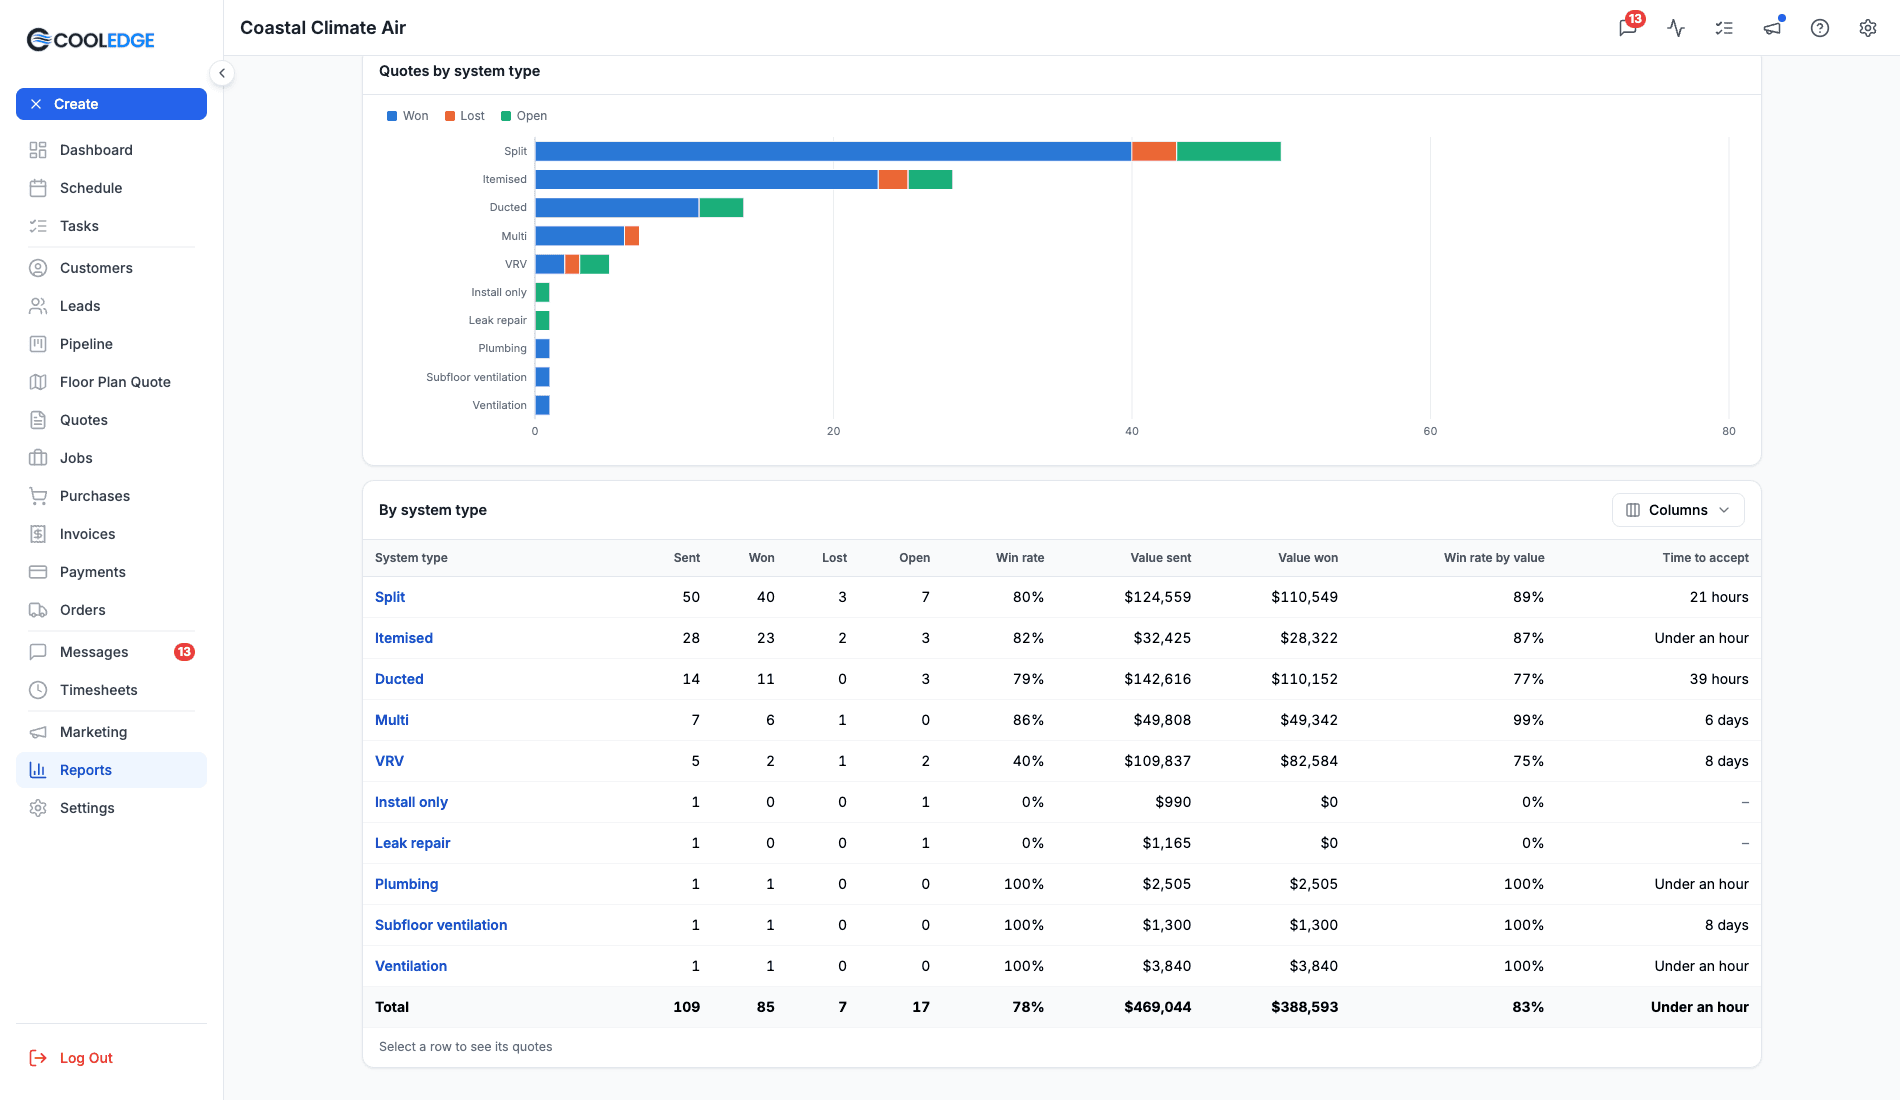
- System type: Split, Ducted, Multi, VRV, Itemised and your other quote types
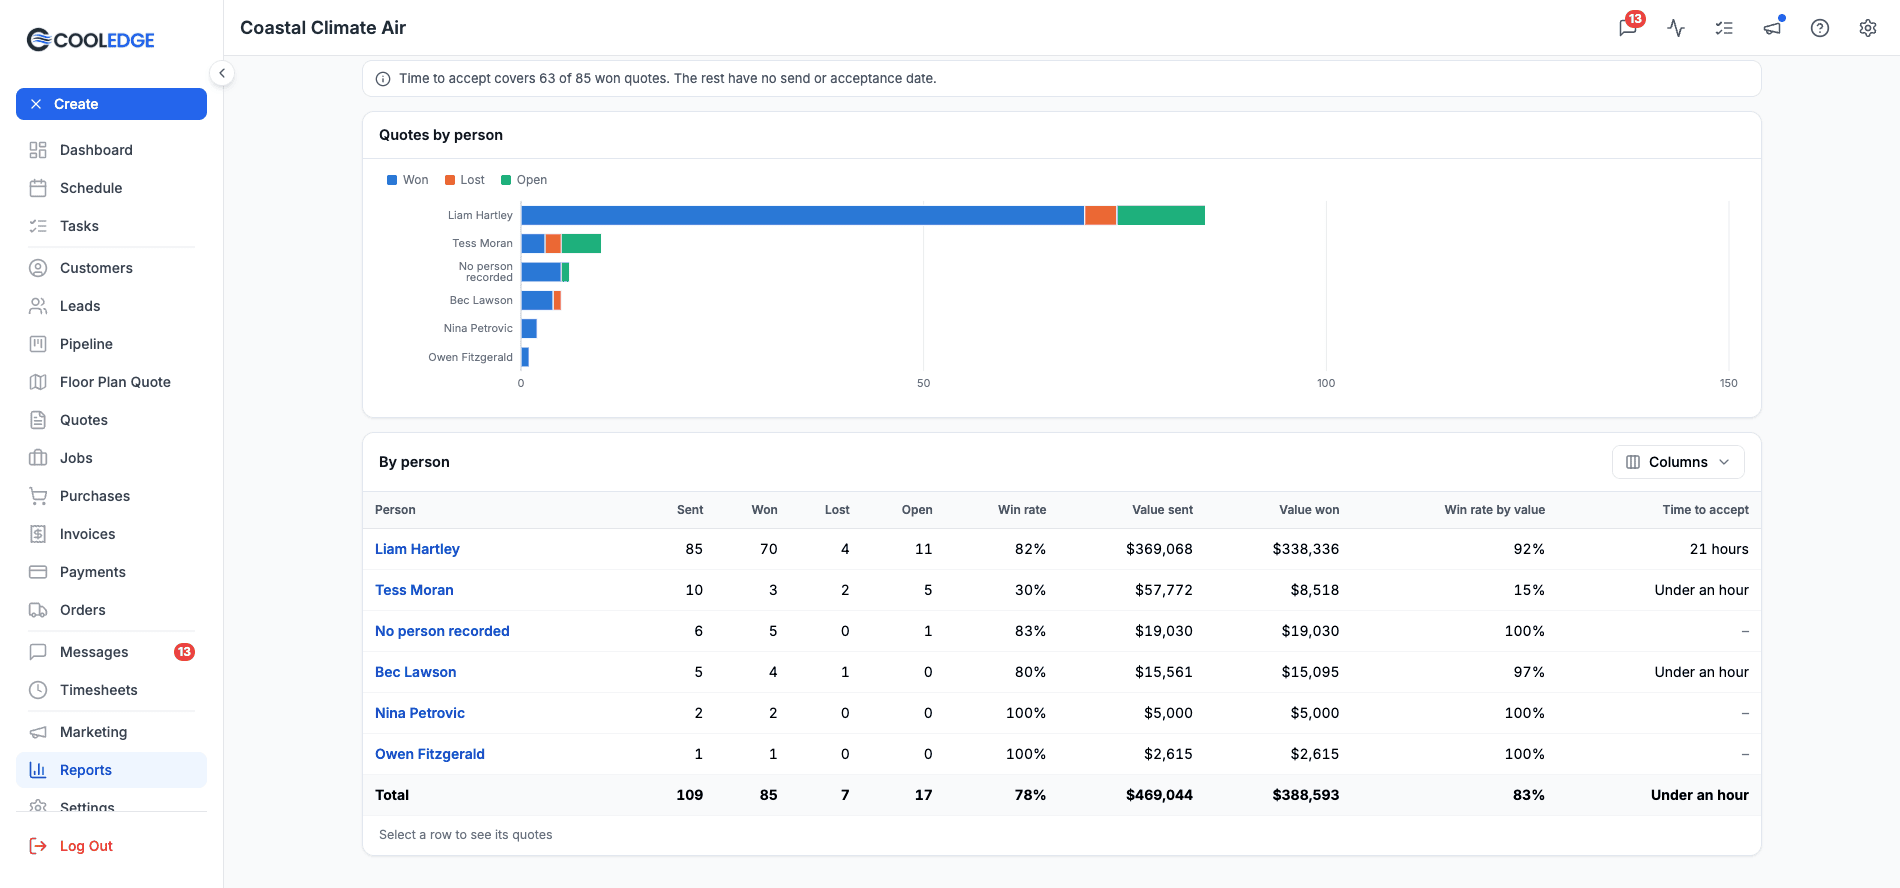
- Person: the person each quote belongs to, usually whoever created it. No person recorded collects quotes with nobody on them
- Lead source: the source of the lead each quote came from. No lead collects quotes that weren't linked to a lead
- Quote: one row per quote
Every grouping shows Sent, Won, Lost, Open, Win rate, Value sent, Value won, Win rate by value and Time to accept. Click a system type, person or lead source to see its quotes.
The Quote View
Group by Quote to see one row per quote with Reference, Customer, System type, Person, Lead source, Sent, Status, Value, Accepted and Time to accept. Status shows the quote's own status, so a Pending quote is one the figures count as Open.
Click a row to open the quote. Back to Quote performance report takes you back to the same view.
You can filter by Outcome, System type, Person and Lead source.
Lead Sources
Reports > Lead sources lists the leads that came in during a date range, where they came from and what happened to them.
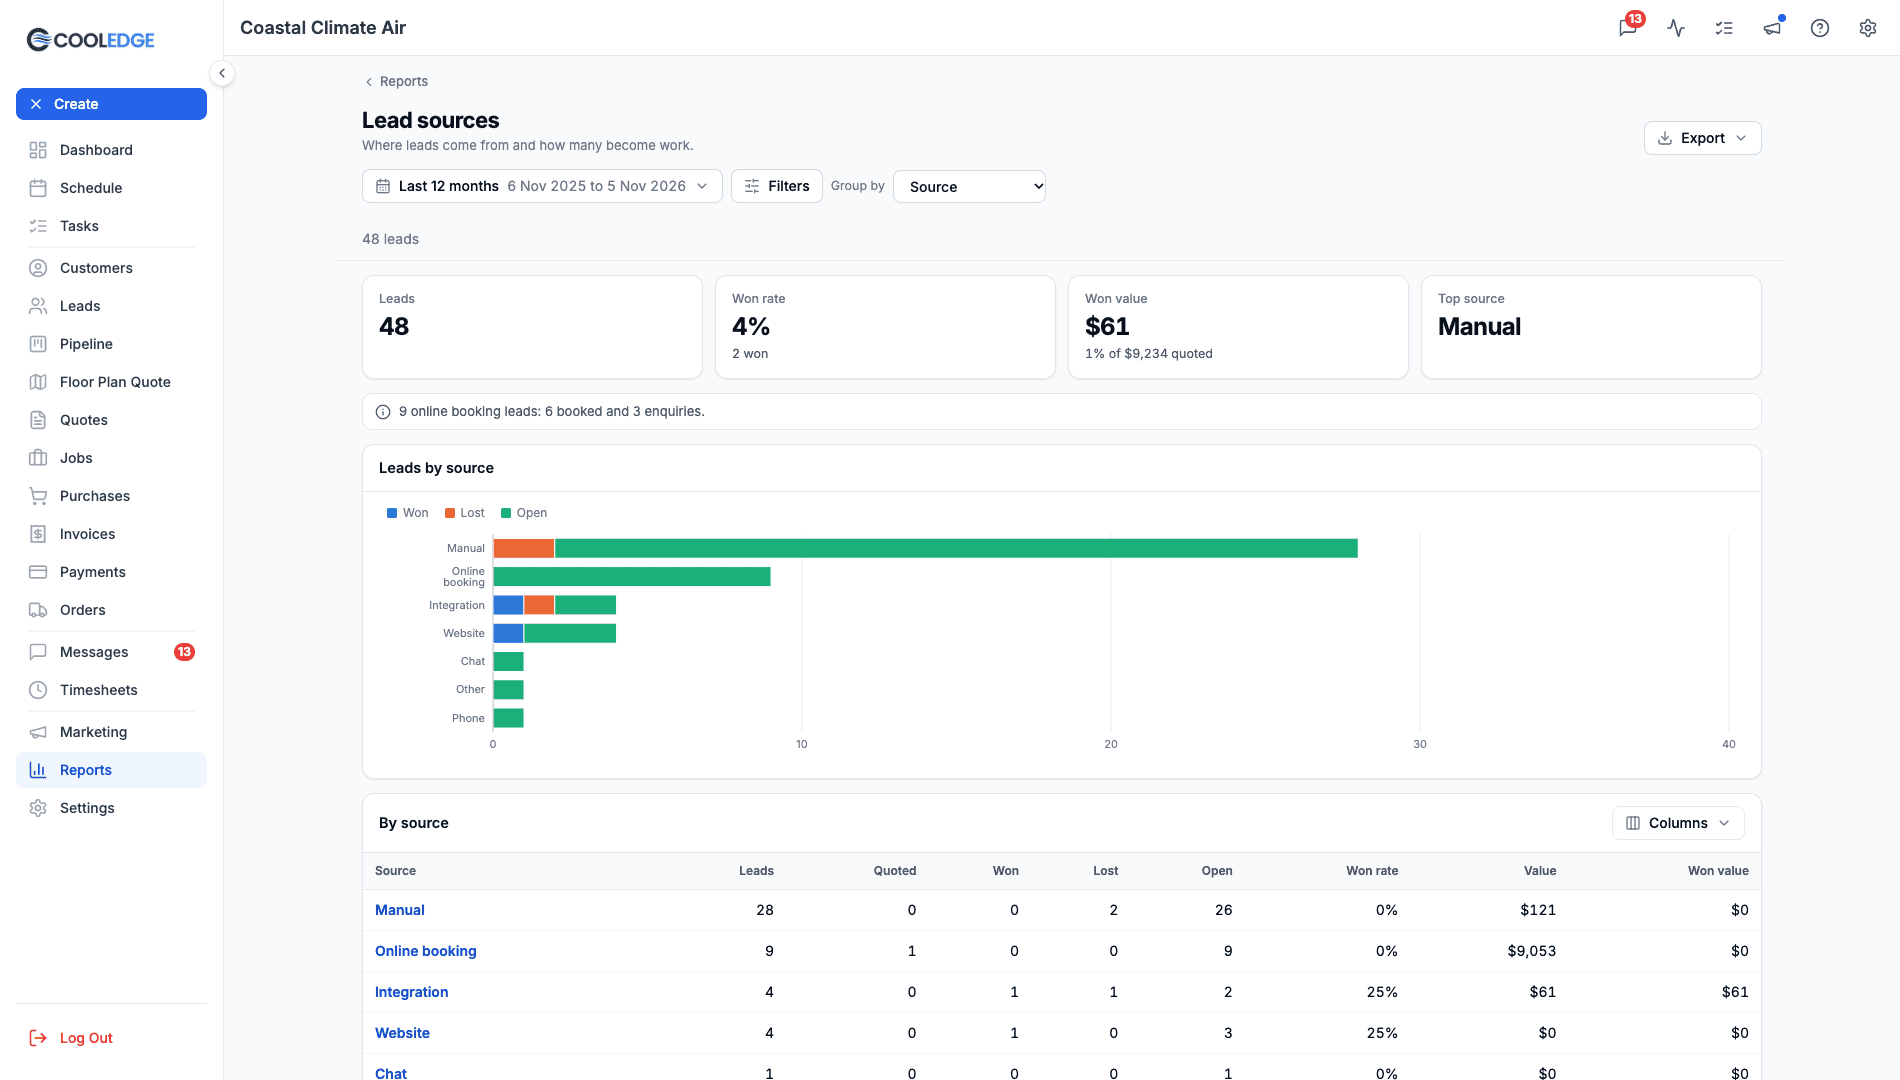
Which Leads Count
A lead is in the range by the day it came in. Marketplace leads count once you've claimed them. Each lead has an outcome from its status: Won and Lost are those statuses and every other status is Open.
Headline Figures
| Figure | What it shows |
|---|---|
| Leads | Every lead that came in during the range |
| Won rate | Won leads out of all leads, with how many were won |
| Won value | The value of the leads you won. The line under it shows that as a share of everything quoted, such as 38% of $623,400 quoted |
| Top source | The source that brought in the most leads |
A lead's Value comes from its quotes. It's the accepted amount of the quotes the customer accepted. If none has been accepted, it's the quoted amount. If the lead has no quote with a value, it's the total of the invoices on the lead's jobs, Draft invoices included and Void ones left out. Draft and Archived quotes never count. A quote belongs to a lead when it's linked to the lead, or to a job that came from the lead.
Group By
- Source (the default): Website, Online booking, Phone, Chat, Marketplace, Integration, Manual and Other
- Channel: how the customer found you, from your own channel list. A lead with no channel counts as Direct
- Campaign: the UTM campaign on the link the customer used. No campaign collects the rest. Add UTM tags to your shared links to see campaigns here
- Form: the form each lead came through. No form collects leads that didn't come through a form
- Landing page: your pages, with Views (all time). No landing page collects leads that didn't come through a page
- Status: your lead statuses, such as New, Contacted, Quoted, Converted, Won and Lost
- Period: one row per day, week or month
- Lead: one row per lead
Every grouping shows Leads, Quoted, Won, Lost, Open, Won rate, Value and Won value. Click a source, channel or status to see its leads.
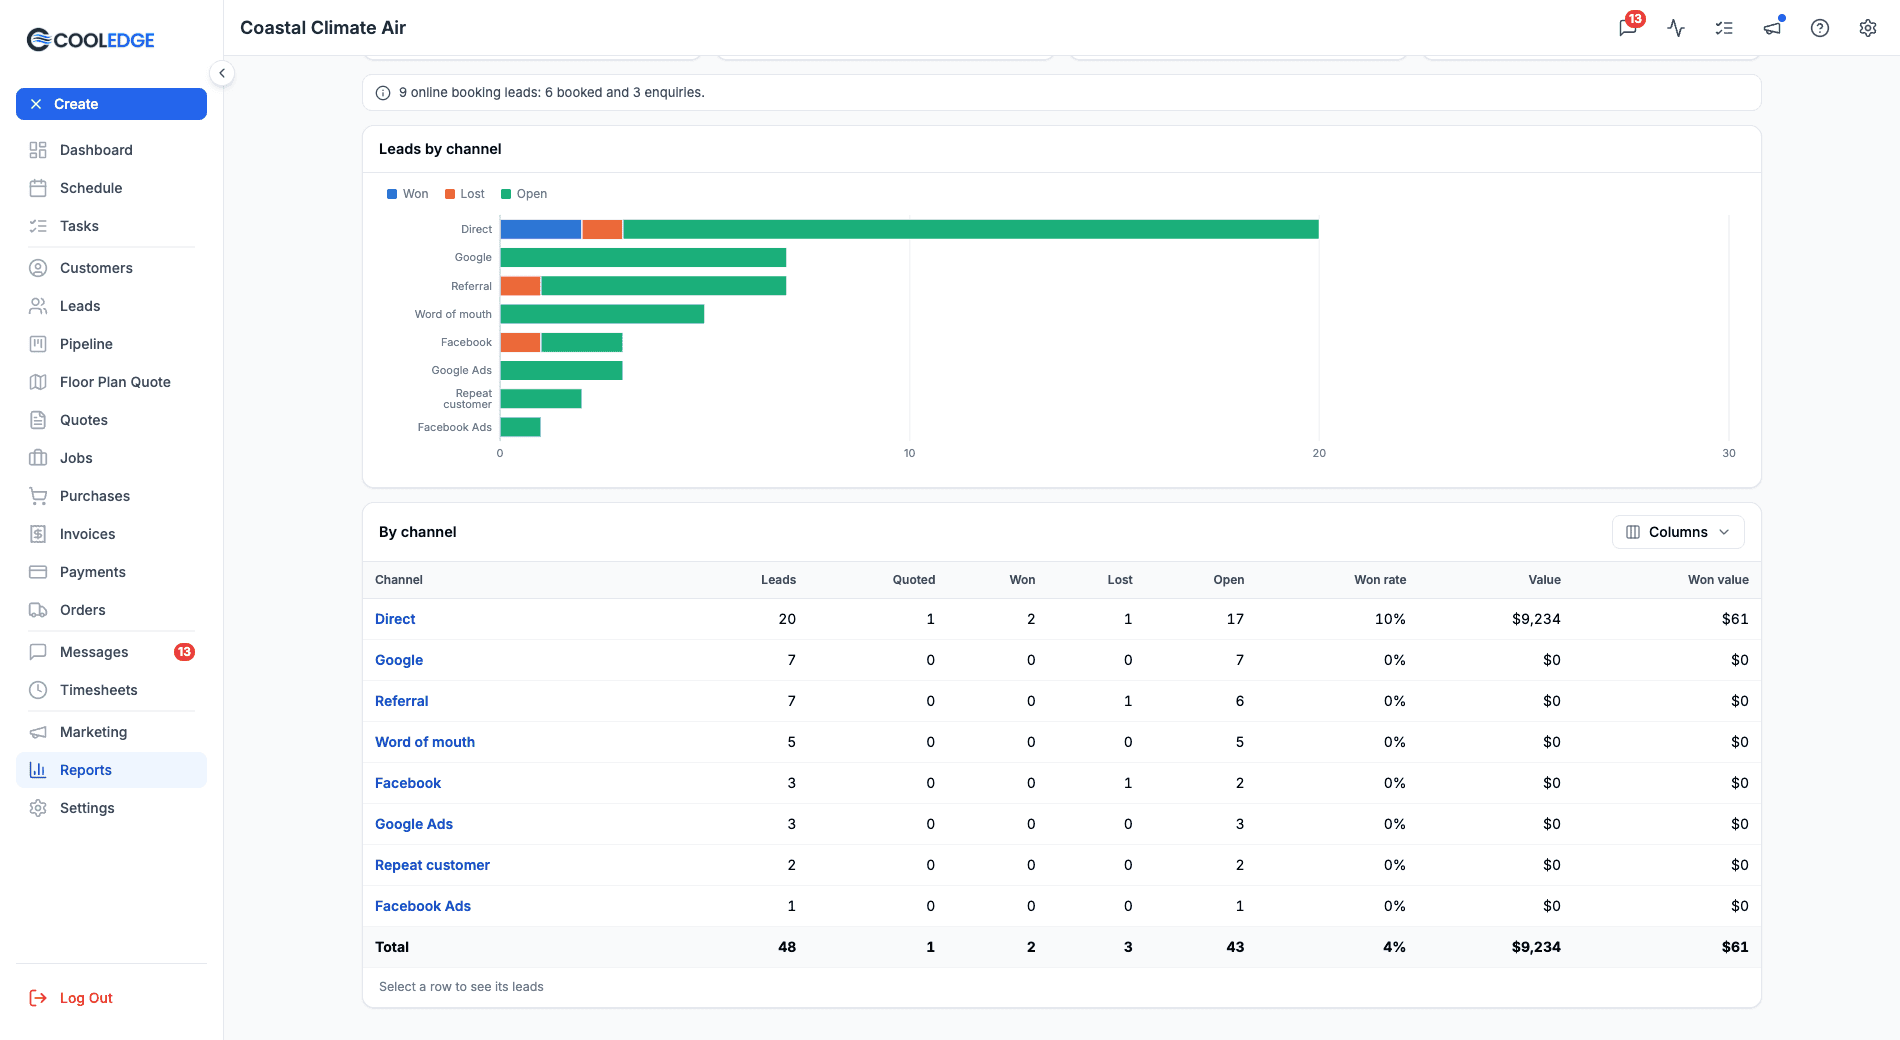
What Quoted Counts
Quoted counts leads with a linked quote that isn't a Draft or Archived. It doesn't look at the lead's status. That means:
- A lead you won still counts as quoted
- A lead at the Quoted status with no linked quote shows Quoted in its row but doesn't add to the Quoted column
Forms and Landing Pages
- With no Source, Channel or Status filter on, Landing page lists every page you host, even one with no leads in the range. A busy page with no leads is the one to fix. With one of those filters on, it lists only the pages with matching leads
- Views (all time) is the page's total views since you published it, not just the range. Views include repeat visits and bots, so treat them as a guide
- If you delete a form or a landing page, its leads stay in the report under No form or No landing page
- Leads need time to close, so recent leads show a lower won rate. Keep that in mind when you compare a new form with an old one
Online Bookings
A note shows how many leads came from online bookings in the range, how many booked a time and how many were enquiries.
The Lead View
Group by Lead to see one row per lead with Name, Created, Source, Channel, Campaign, Status and Value. Source here shows the exact source, such as Website Form or Landing Page, where the grouping above rolls them up into Website.
Click a row to open the lead. Back to Lead sources report takes you back to the same view.
You can filter by Source, Channel and Status.
Where Leads Reporting Went
Lead sources replaces the old Leads > Reporting page. The Reporting tab on the Leads page opens this report and old links to the reporting page land here too. Everything the old page showed has a home here: the timeline is Period, the status breakdown is Status and the top forms are Form.
Two things are gone:
- All time. A range can be up to 400 days. Use Last 12 months, Last financial year or a custom range
- View to lead. It divided a range's leads by a page's views over its whole life, which isn't a real conversion rate. Views (all time) is still listed next to each page
Export to CSV or PDF
- Download CSV downloads every row, in the table's sort order, with the columns you're showing. Tick CSV: include all columns to get every column. Money columns are labelled inc GST. On Quote performance, Hours to accept gives the time in hours
- Download PDF makes an A4 landscape PDF with your logo and business name, the dates and filters, the headline figures, the chart and the table. It holds up to 1,000 rows. For more, download the CSV
Exports never include a lead's phone, email, address or form answers.
Who Can See It
- Owners see both reports and can export
- Admins see both reports but can't export
- Members and restricted members don't see reports
Common Questions
Why is my win rate lower than I expected? Open quotes count against it until customers decide. Options sent as separate quotes count as Lost once the ones the customer didn't pick expire. Archived quotes count as Lost too.
In ServiceM8 mode, why does the Dashboard show a different win rate? The Dashboard's Win rate looks at the last 30 days by the day each quote was created. Quote performance uses the range you pick and the day each quote was sent.
Why doesn't Median time to accept cover all my won quotes? It needs both a send date and an acceptance date. A quote marked as won without the customer accepting it online may have no acceptance date.
Why does a quote show in a later month than I expected? It was sent again. A quote counts from its latest send date.
Can I see all time? No. A range can be up to 400 days, so every report stays fast. Pick Last financial year or Last 12 months.
What does "Too many quotes for one report" mean? The range holds more quotes or leads than the report can load at once. Choose a shorter range.
Related
- Lead Capture: Forms, landing pages, the chat widget and lead statuses
- Linking Leads to Quotes and Jobs: How quotes and jobs get linked to a lead and how to set up your channel list
- Online Bookings: Self-service booking pages
- Money Reports: Receivables, cash collected, work to invoice and rebates
- Job Profitability Report: Revenue, costs and margin for every job
Was this article helpful?
Let us know if you found this information useful.
Still need help? Contact support
In this article
Use your browser's search (Ctrl+F) to quickly find specific topics within this article.
Browse all help articles →Related Articles
Auto Duct Layout
Visual duct designer on the ducted floor plan wizard. Auto-route or draw by hand. Includes outdoor unit and refrigerant pipework. Drives the take-off.
Business Callouts (Why Choose Us)
Display trust-building callout points on your public quote pages to increase acceptance rates
Custom PDF Pages
Add professional cover pages, warranty info, maintenance plans and more to your quote and invoice PDFs